
When you wake up in the morning do you start your day with a nice refreshing shower? Have a glass of water? Make a coffee/tea? Brush your teeth? Use the washroom and wash your hands? You more than likely answered yes to at least one of these things. This is because you are probably part of the 90 plus percent of the world’s population that has access to improved water sources. Being in this 90 plus percent we tend to take our water consumption for granted and not think about how much we use and how much our lives would be impacted if we lost our direct source of water to our house. In this modern day and age, water is so widely available that we tend not to think much about the places that don’t have such easy access. In the picture (picture from ((1) worldindata.org “Water Use and Sanitation”)) below you can see that most of the world has access to an “improved” water source which seems like a lot.
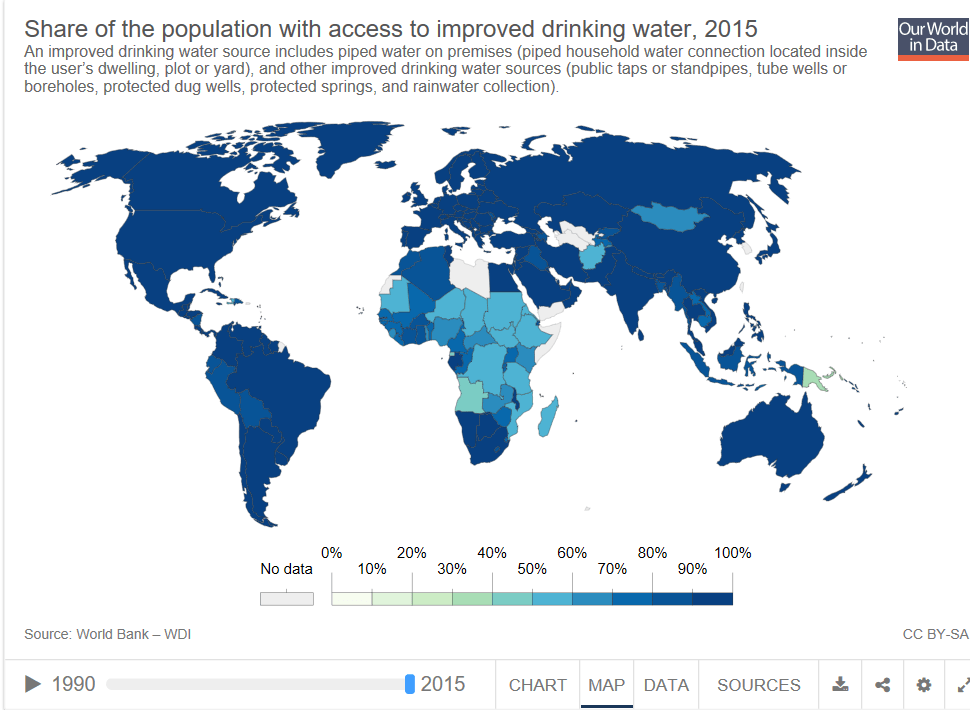
If you take into perspective of the world population is currently around 7.6 billion ((2) Current world population) which 90 percent is 6.84 billion people with and 760 million people without “improved” access to water. (keep in mind that this calculation is not exact as it was done with world population and not with each country’s exact populations and percent).
But as our population grows there is more of an effort to increase “improved” water sources so that our species can continue to grow and continue to thrive without going into to extinction. In the pictures below (from (1) worldindata.org “Water Use and Sanitation”)) you can see the place where more areas in the world have implemented “improved” water systems allowing people to continue to sustain a healthy and stable environment to continue to live in a retrieve water easily.
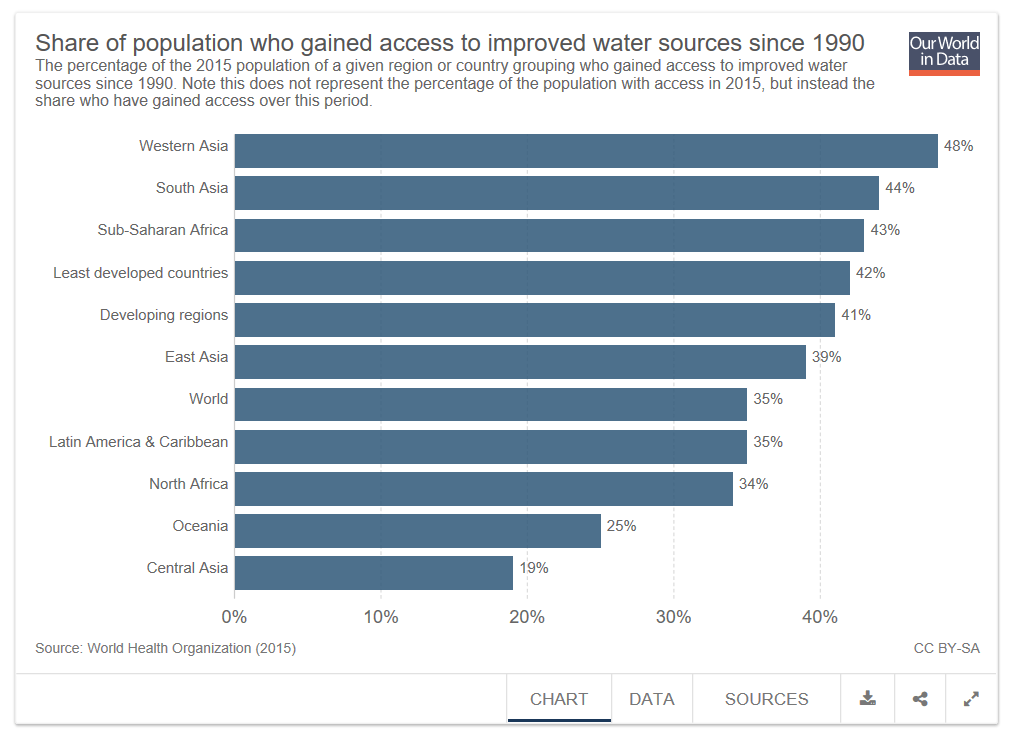
As you can see in this graph Asia and Africa has really tried to increase their water systems this is because of their ever so rapidly increasing population. They need to have “improved” water systems to supply their population with water to keep their countries sustainable. As you can see there is an overall increase with “Improved” water sources around the world, decreasing the amount of thirsty and dehydrated individuals who must walk great distances for a source of water.
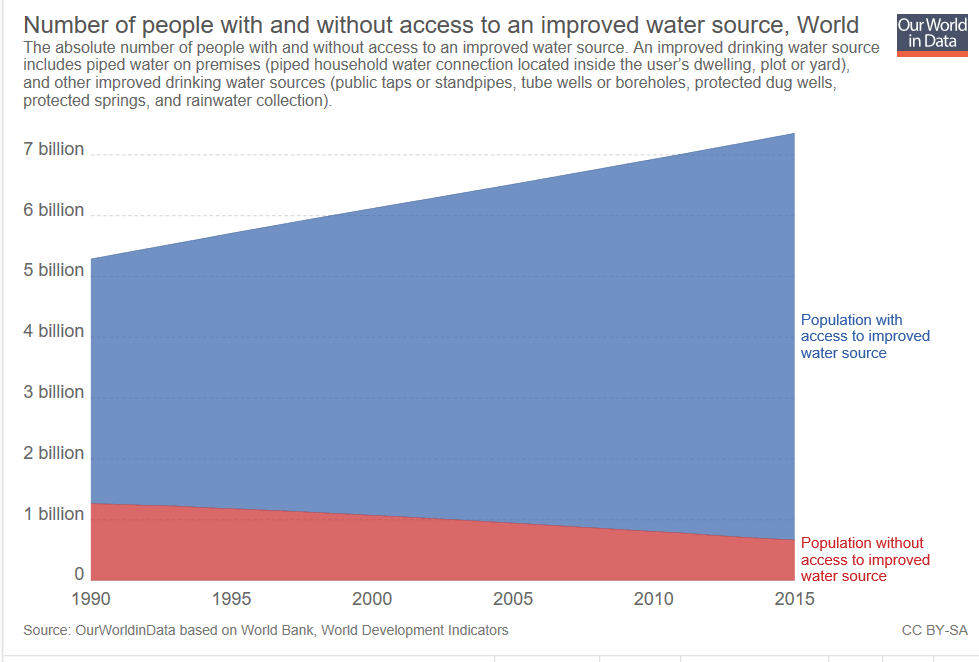
As you can see in the picture above (from (1) worldindata.org “Water Use and Sanitation”)) it resembles the calculation done earlier showing how many people in the world currently have and do not have “improved” water systems. As you can see the amount of “improved” water systems in the world are quickly increasing and is well over 6 billion approaching 7 billion in 2015; our calculation for 2018 is roughly around 6.84 billion people with “improved” water sources. Also observed from above is the rapidly decreasing amount of people without these water sources with less than a billion in 2015, and our calculation above with the population of 2018 coming in at 760 million which is still a lot when just hearing that number, but it is relatively small compared to the world’s population.
With an increasing population, this leads to more water consumption. In the picture below (from (1) worldindata.org “Water Use and Sanitation”)) the chart shows the places that withdrawing the most water from the earth.
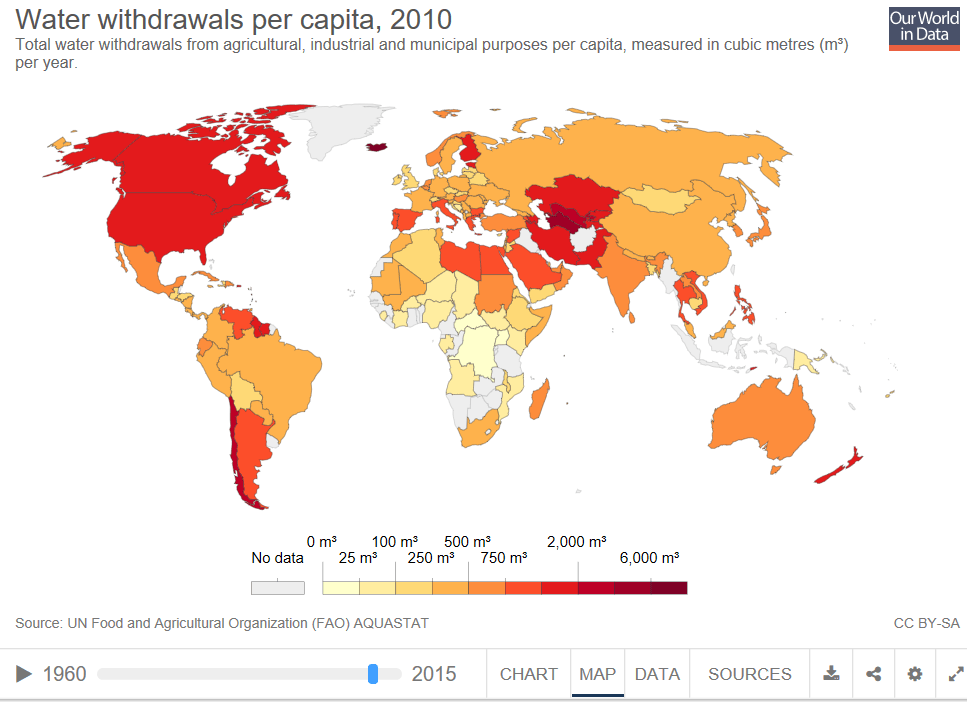
As you can see North America and Kazakhstan in 2010 had just below 2000 m3. Chile and a few other places were well above that with between 2000 m3 and below 6000 m3 in 2010. If you go to worldindata.org (our first reference) you can see that the water withdrawals have significantly increased, and you can play with the slider to change the year to get a visual representation. From playing with the slider were able to visually see that as the population rises as the years go on the more water we use.
As the population rises there is more of a demand for water but depending on which country you are from you don’t always have very many freshwater sources around you. From worldindata.org we were able to find a chart that shows the places and their volume of freshwater which we have added below (from (1) worldindata.org “Water Use and Sanitation”)).
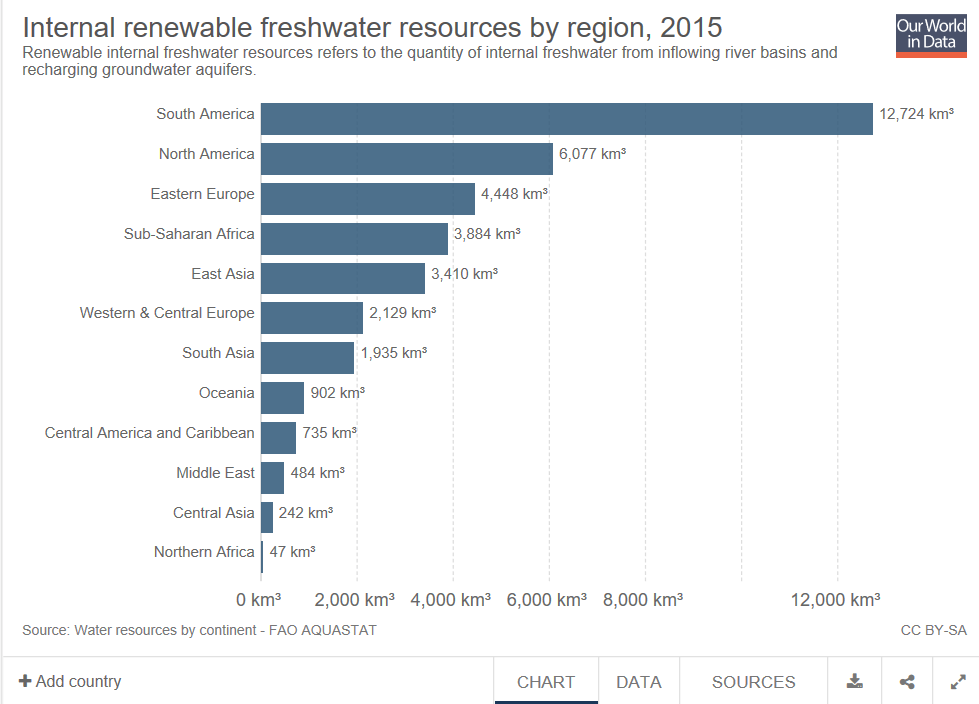
As you can see here the amount of fresh water resources drastically drops as you go down the list as you see North America is in second with nearly half of what South America has. The last one on the list Northern Africa has absolutely nothing compared to South America. This is another reason why some places have a hard time getting the water they need to survive just because of geographically they don’t have a lot of water and if they don’t have pipelines to bring it, they must go get it themselves walking for several kilometers. Which brings to another point of how in the lesser fortunate countries who must gather water several kilometers away it is normally a “women’s job” to do so. “Women are disproportionately affected by the water crisis, as they are often responsible for collecting water. This takes time away from work, school and caring for the family. The lack of water and sanitation locks women in a cycle of poverty. Empowering women is critical to solving the water crisis. When women have access to safe water at home, they can pursue more beyond water collection and their traditional roles. They have time to work and add to their household income.” (“Water Crisis – Learn About The Global Water Crisis.” Water.org, water.org/our-impact/water-crisis/.). Also, according to water.org (our third reference) women and kids spend accumulatively spend 200 million hours collecting water daily. The amount of time collecting water each day could be used towards something like schooling that could help some of these places get out of poverty. Within these high poverty places, the quality of their water they are retrieving is not very sanitary. With the water not being sanitary it can cause diseases when ingested and in more low-income economies that’s hard to deal with as hospital bills and medication can be expensive.
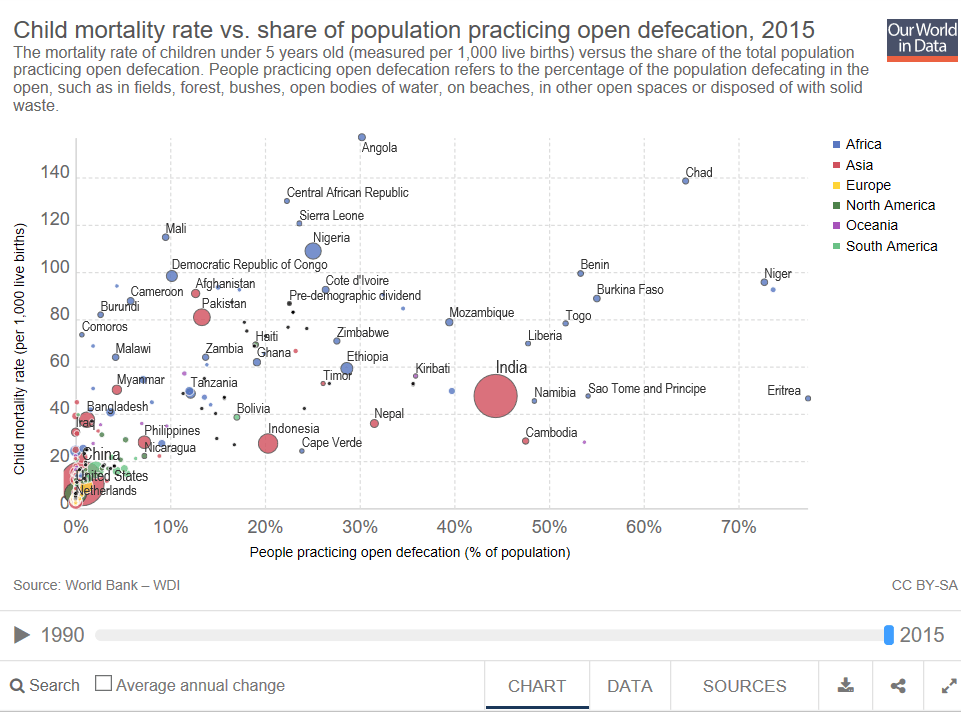
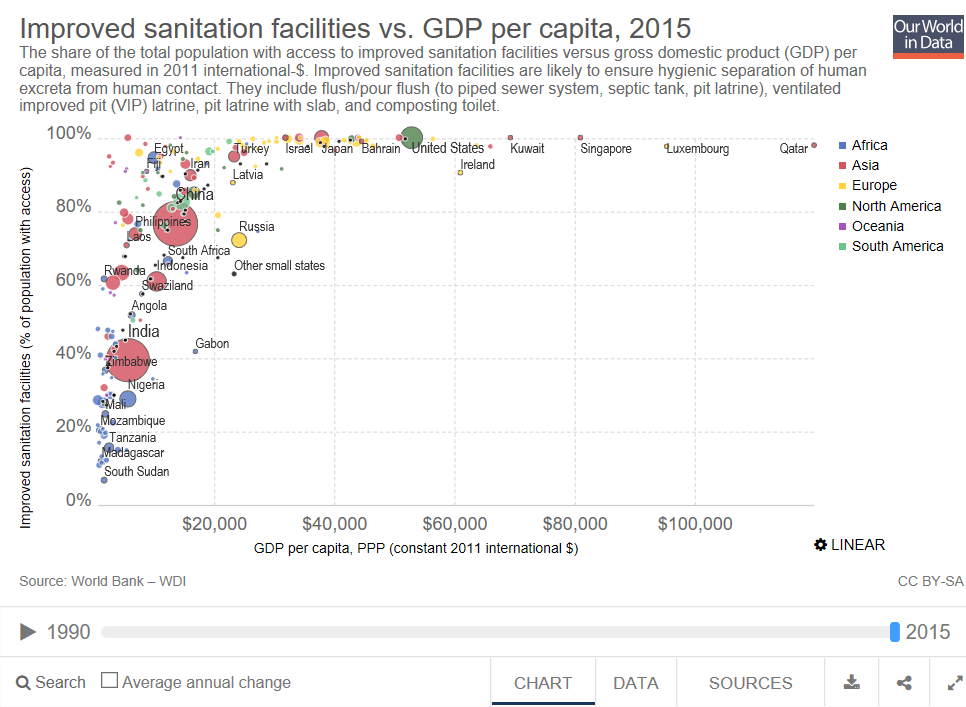
As you can see from the picture above (from (1) worldindata.org “Water Use and Sanitation”)) the countries with lower incomes and less sanitary systems in place for filtering water have higher child death rates. This is because they are defecating in fields and waterways and it is getting into food and water sources and children cannot fight over these bacteria that is excreted from their feces. But if we look at the picture below (from (1) worldindata.org “Water Use and Sanitation”)) we can see that the places that have the higher child mortality rate due to practicing open defecation have fewer sanitation facilities. These sanitation facilities allow for the water to be filtered and kill bad bacteria before we send it back to the environment.
In Conclusion, not everyone has a direct pipeline going to their house with clean drinkable water. For example, in Flint Michigan in 2014 they had waterline going to houses but they had not filtered their water properly. This led to many people getting lead poisoning and killing dozens of people. So, don’t take you clean drinkable water for granted as it might not always be there.
Work sited:
1) “Water Use and Sanitation.” Our World in Data, ourworldindata.org/water-use-sanitation#access-to-improved-water-sources.
2) “Current World Population.” United Arab Emirates Population (2018) – Worldometers, www.worldometers.info/world-population/.
3) “Water Crisis – Learn About The Global Water Crisis.” Water.org, water.org/our-impact/water-crisis/.

 Environmental sustainability Group 17